Data Visualization with QGIS
- Time14.00 - 16.00 CET (UTC+1)
- Duration4 sessioner (6 t)
- Price2800 dkk - €375 excl. VAT
- PlaceOnline
- TeacherKurt Menke
Course content
QGIS is an open source GIS program that provides unimaginable possibilities for viewing geographic data and compiling maps. Data visualization has become one of the strongest aspects of QGIS. This course will cover some of the most useful techniques now available and will feature Danish datasets. You will also learn to create animations in the 3D viewer and with time based data. If you want to improve your cartography skills and elevate your maps this is the course for you!
In the course you will be learning about:
- Print layouts
- Label blocking
- Legend patch shapes
- Live layer effects
- Rendering Elevation Data
- Hillshade renderer
- Contour renderer
- Blending Modes - These allow for more sophisticated rendering between GIS layers and there are 13 different blending modes available at both the layer and feature level. Here you will learn the most common use cases.
- Layer blending
- Multiply
- Overlay
- Feature blending
- Addition
- Layer blending
- Rendering Point Data - Learn how to effectively use the renderers specific to point data.
- Point cluster
- Heatmap
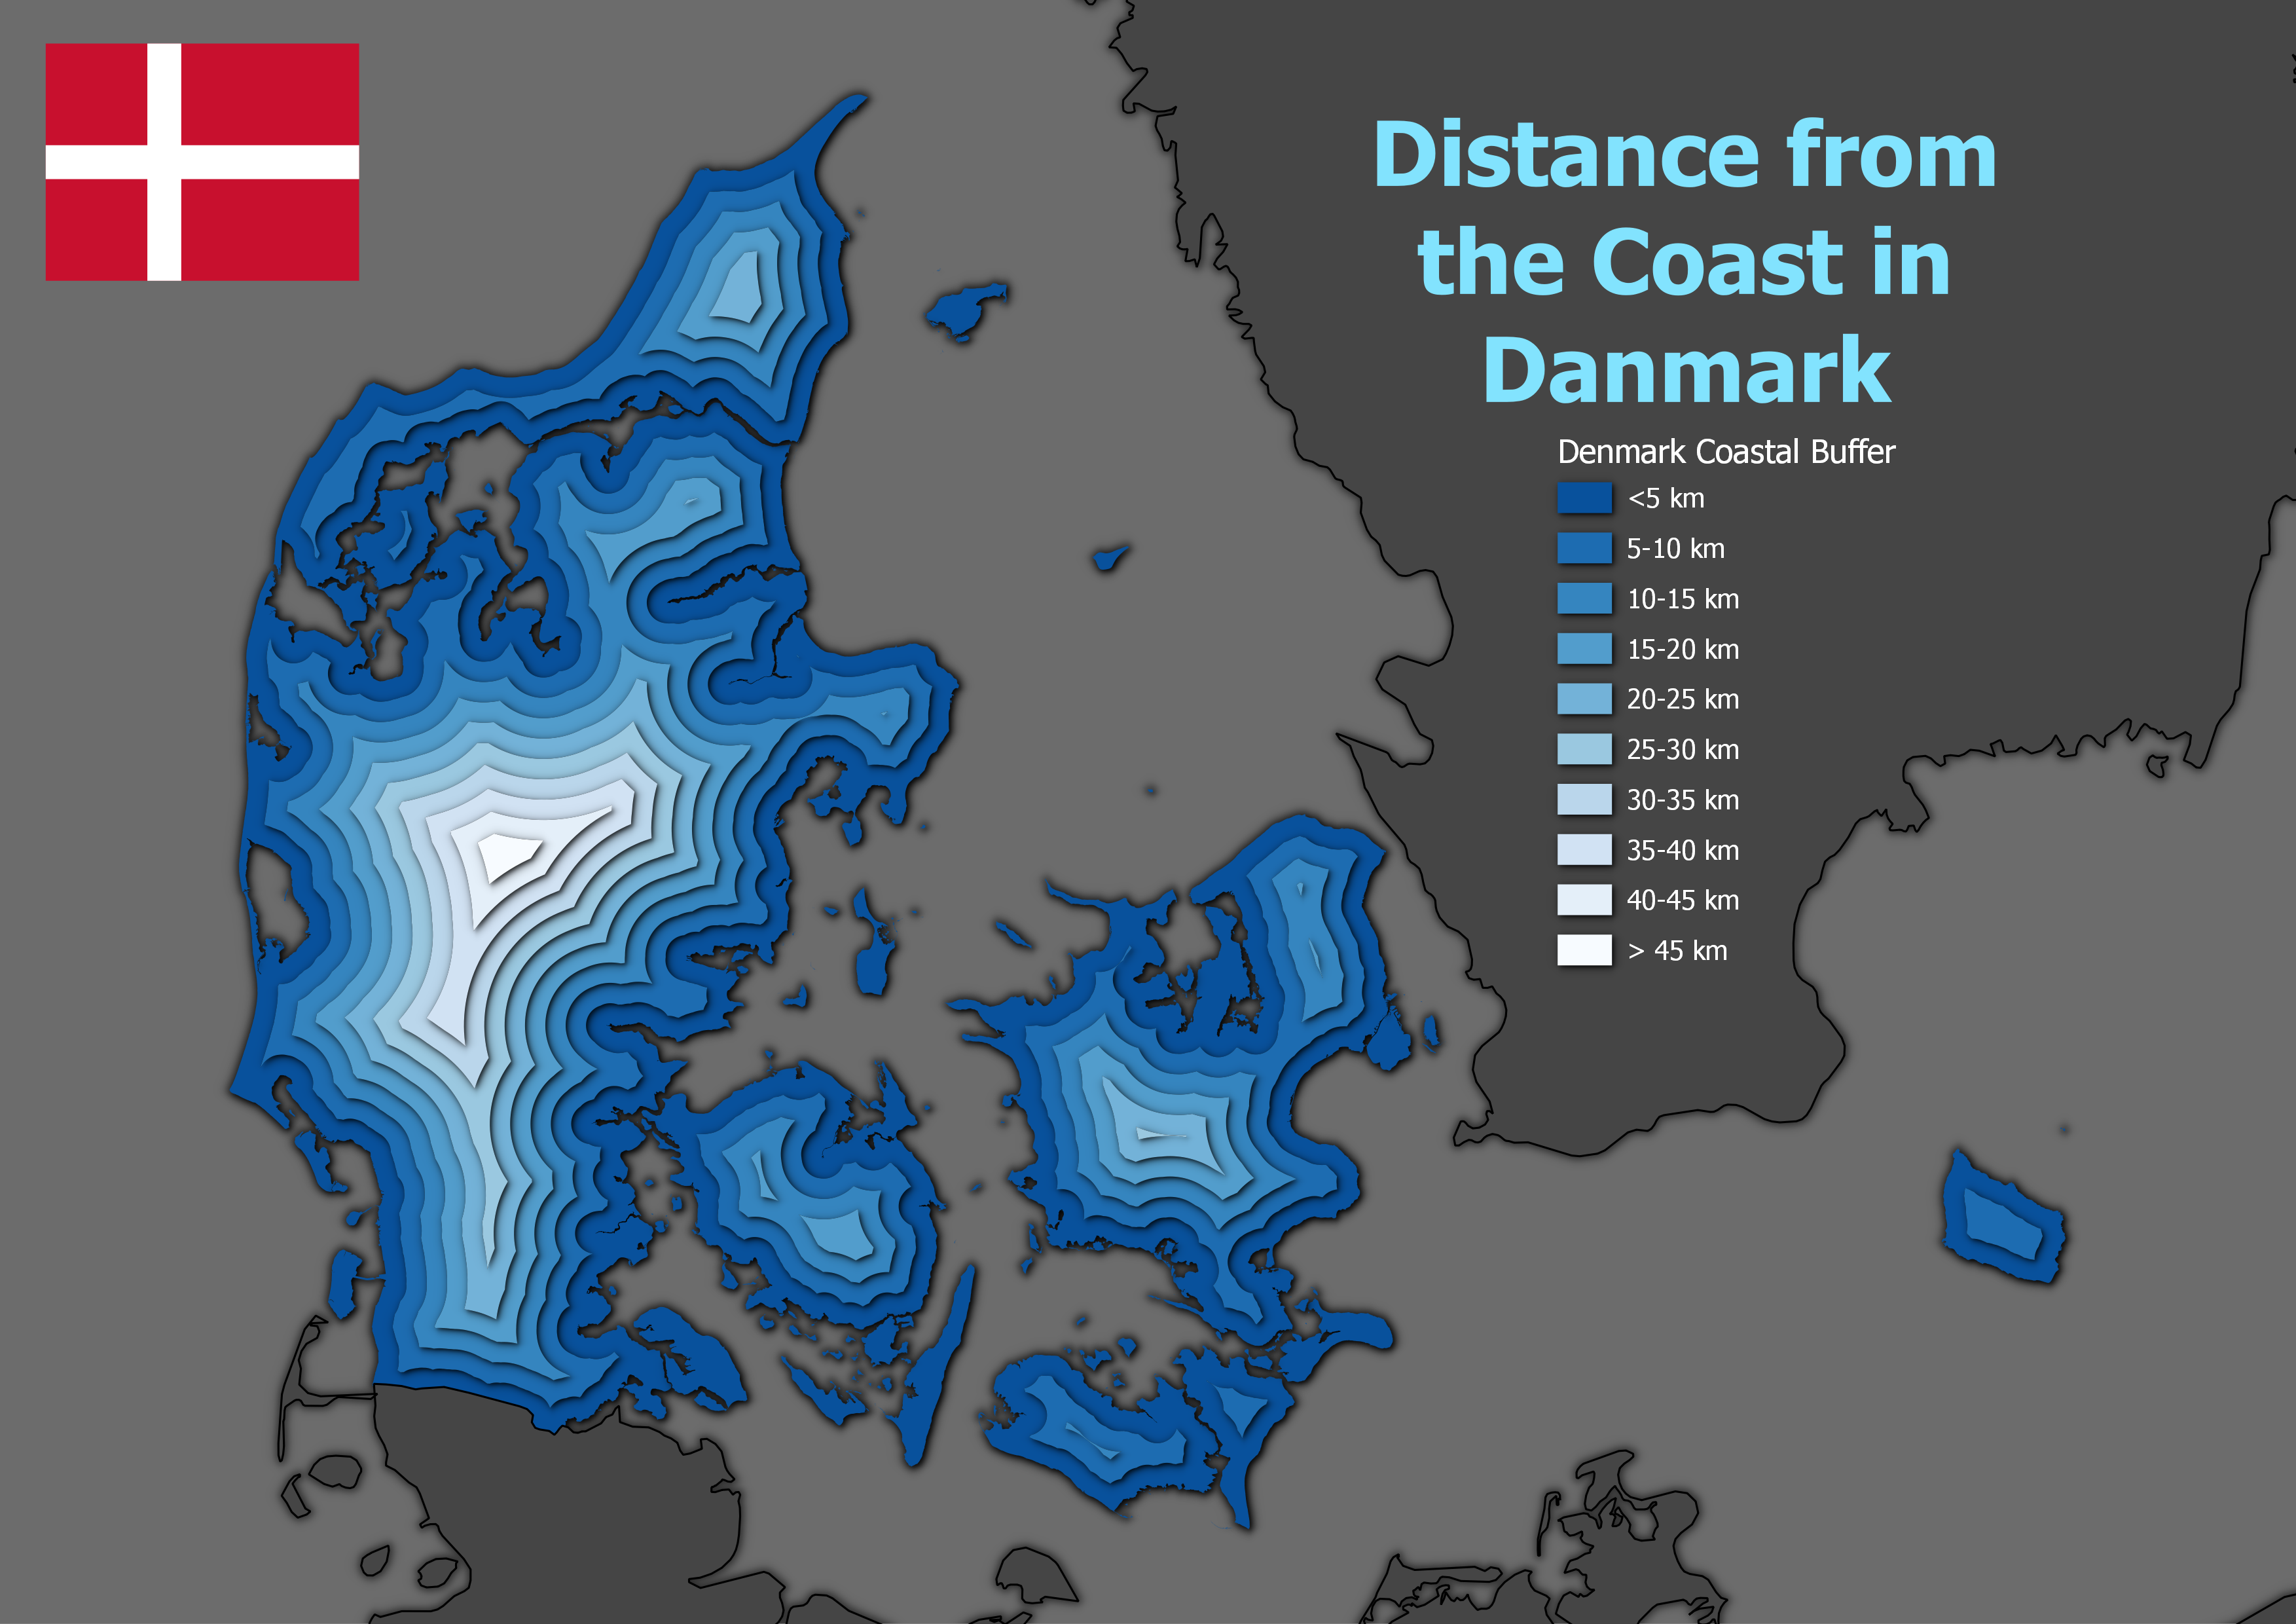
- Coastal Effects
- Coastal Vignette
- Ben-day dots
- Cartographic Processing Algorithms
- Topological coloring
- Expression based symbology - Learn about using Data Defined Overrides with symbology inputs to create more sophisticated symbols.
- Geometry Generator renderer - Learn several use cases for this powerful renderer which allows you to modify the geometry of your features or create new features using geometric expressions.
- Polygons as Points: Centroid vs Pole of inaccessibility
- Internal Buffers
- Temporal Controller - Learn to animate spatial data through time.
- 3D Views - Learn how to work with the native QGIS 3D Viewer
- Mesh data - Learn how to symbolize weather related mesh data
Course format
The course consists of:
- An introductory video
- Two class sessions - 2 hours each
- An assignment that is completed after each session
- Two question/answer sessions with the opportunity to ask questions about each task
Course price
2800DKK - €375 excluding VAT
Introductory video: One week before the course starts you will receive an introductory video with an introduction to working with raster data.
Course sessions: During the two live courses, course instructor Kurt Menke will introduce a series of data visualization techniques.
Assignments: To support learning, after each course session you will be asked to complete an assignment taking approximately 1-2 hours. This must be finished prior to the next course.
Question/answer sessions: These will be held one week after each course session. During these sessions you can ask questions about the assignment.
In addition you will receive a brief manual and a series of short videos covering topics presented in the course sessions.
Course dates
- Session 1: Tuesday 31 January from 14.00 - 16.00 (CET)
- Question/answer session 1: Tuesday 07 February from 14.00 - 15.00 (CET)
- Session 2: Thursday: 09 February from 14:00 - 16.00 (CET)
- Question/answer session 2: Thursday 16 February from 14.00 - 15.00 (CET)
QGIS certified course
The course is certified by the QGIS organization, which has approved the material and the course program. When you participate in this course, you contribute 20 euros to the continued development of QGIS. You will also receive an official certificate after participating in the course.
Practical information
The course is held in English.
QGIS 3.22 is used for the course. You must ensure that you have access to a computer with this version of QGIS (or later version of QGIS) installed before the course. QGIS with either the Danish or English translation can be used.
Register before: 20 January 2023.
Contact Kurt kurt@septima.dk, if you want to hear more about the course, or want to register.