 Af Kurt Menke


It is the first of December which means another 30 Day Map Challenge is over. This event takes place via social media every November. During the month each day has a specific theme (see image above). The challenge is to produce a map each day using the day’s theme, and post it to social media with the #30DayMapChallenge hash tag.
Importantly, it is not a competition and there are no winners. It is about creativity and openness.
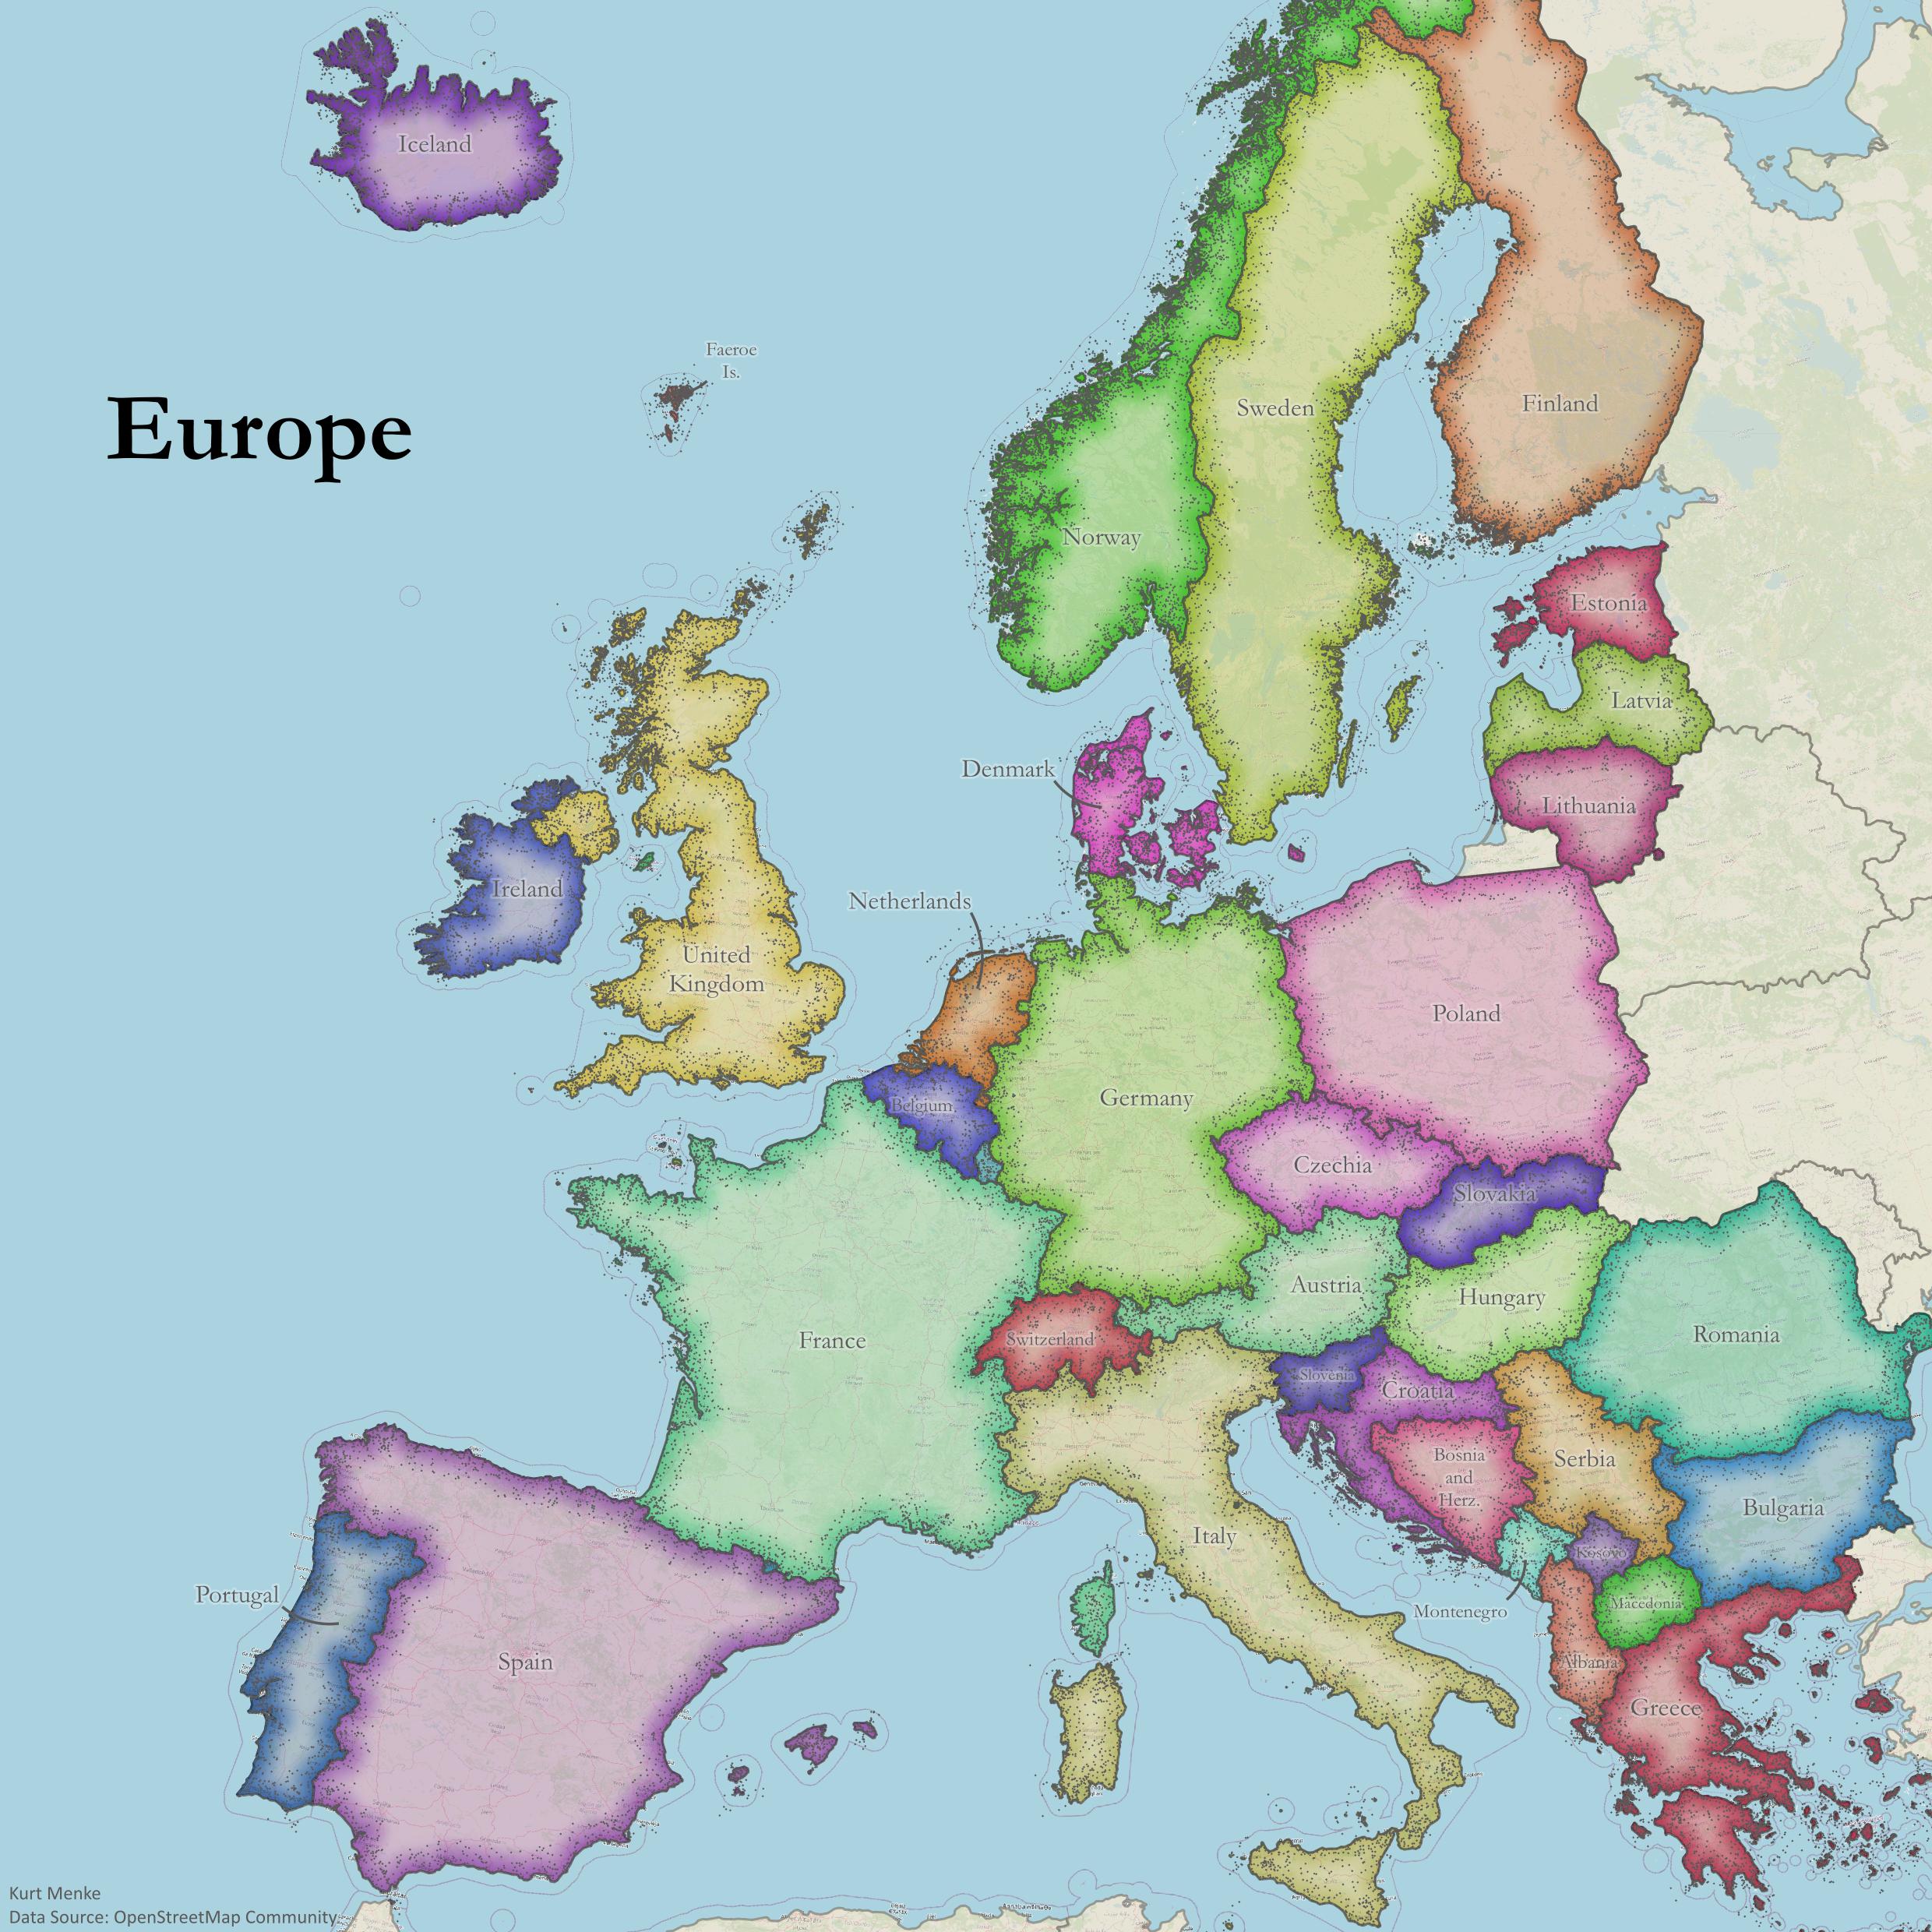
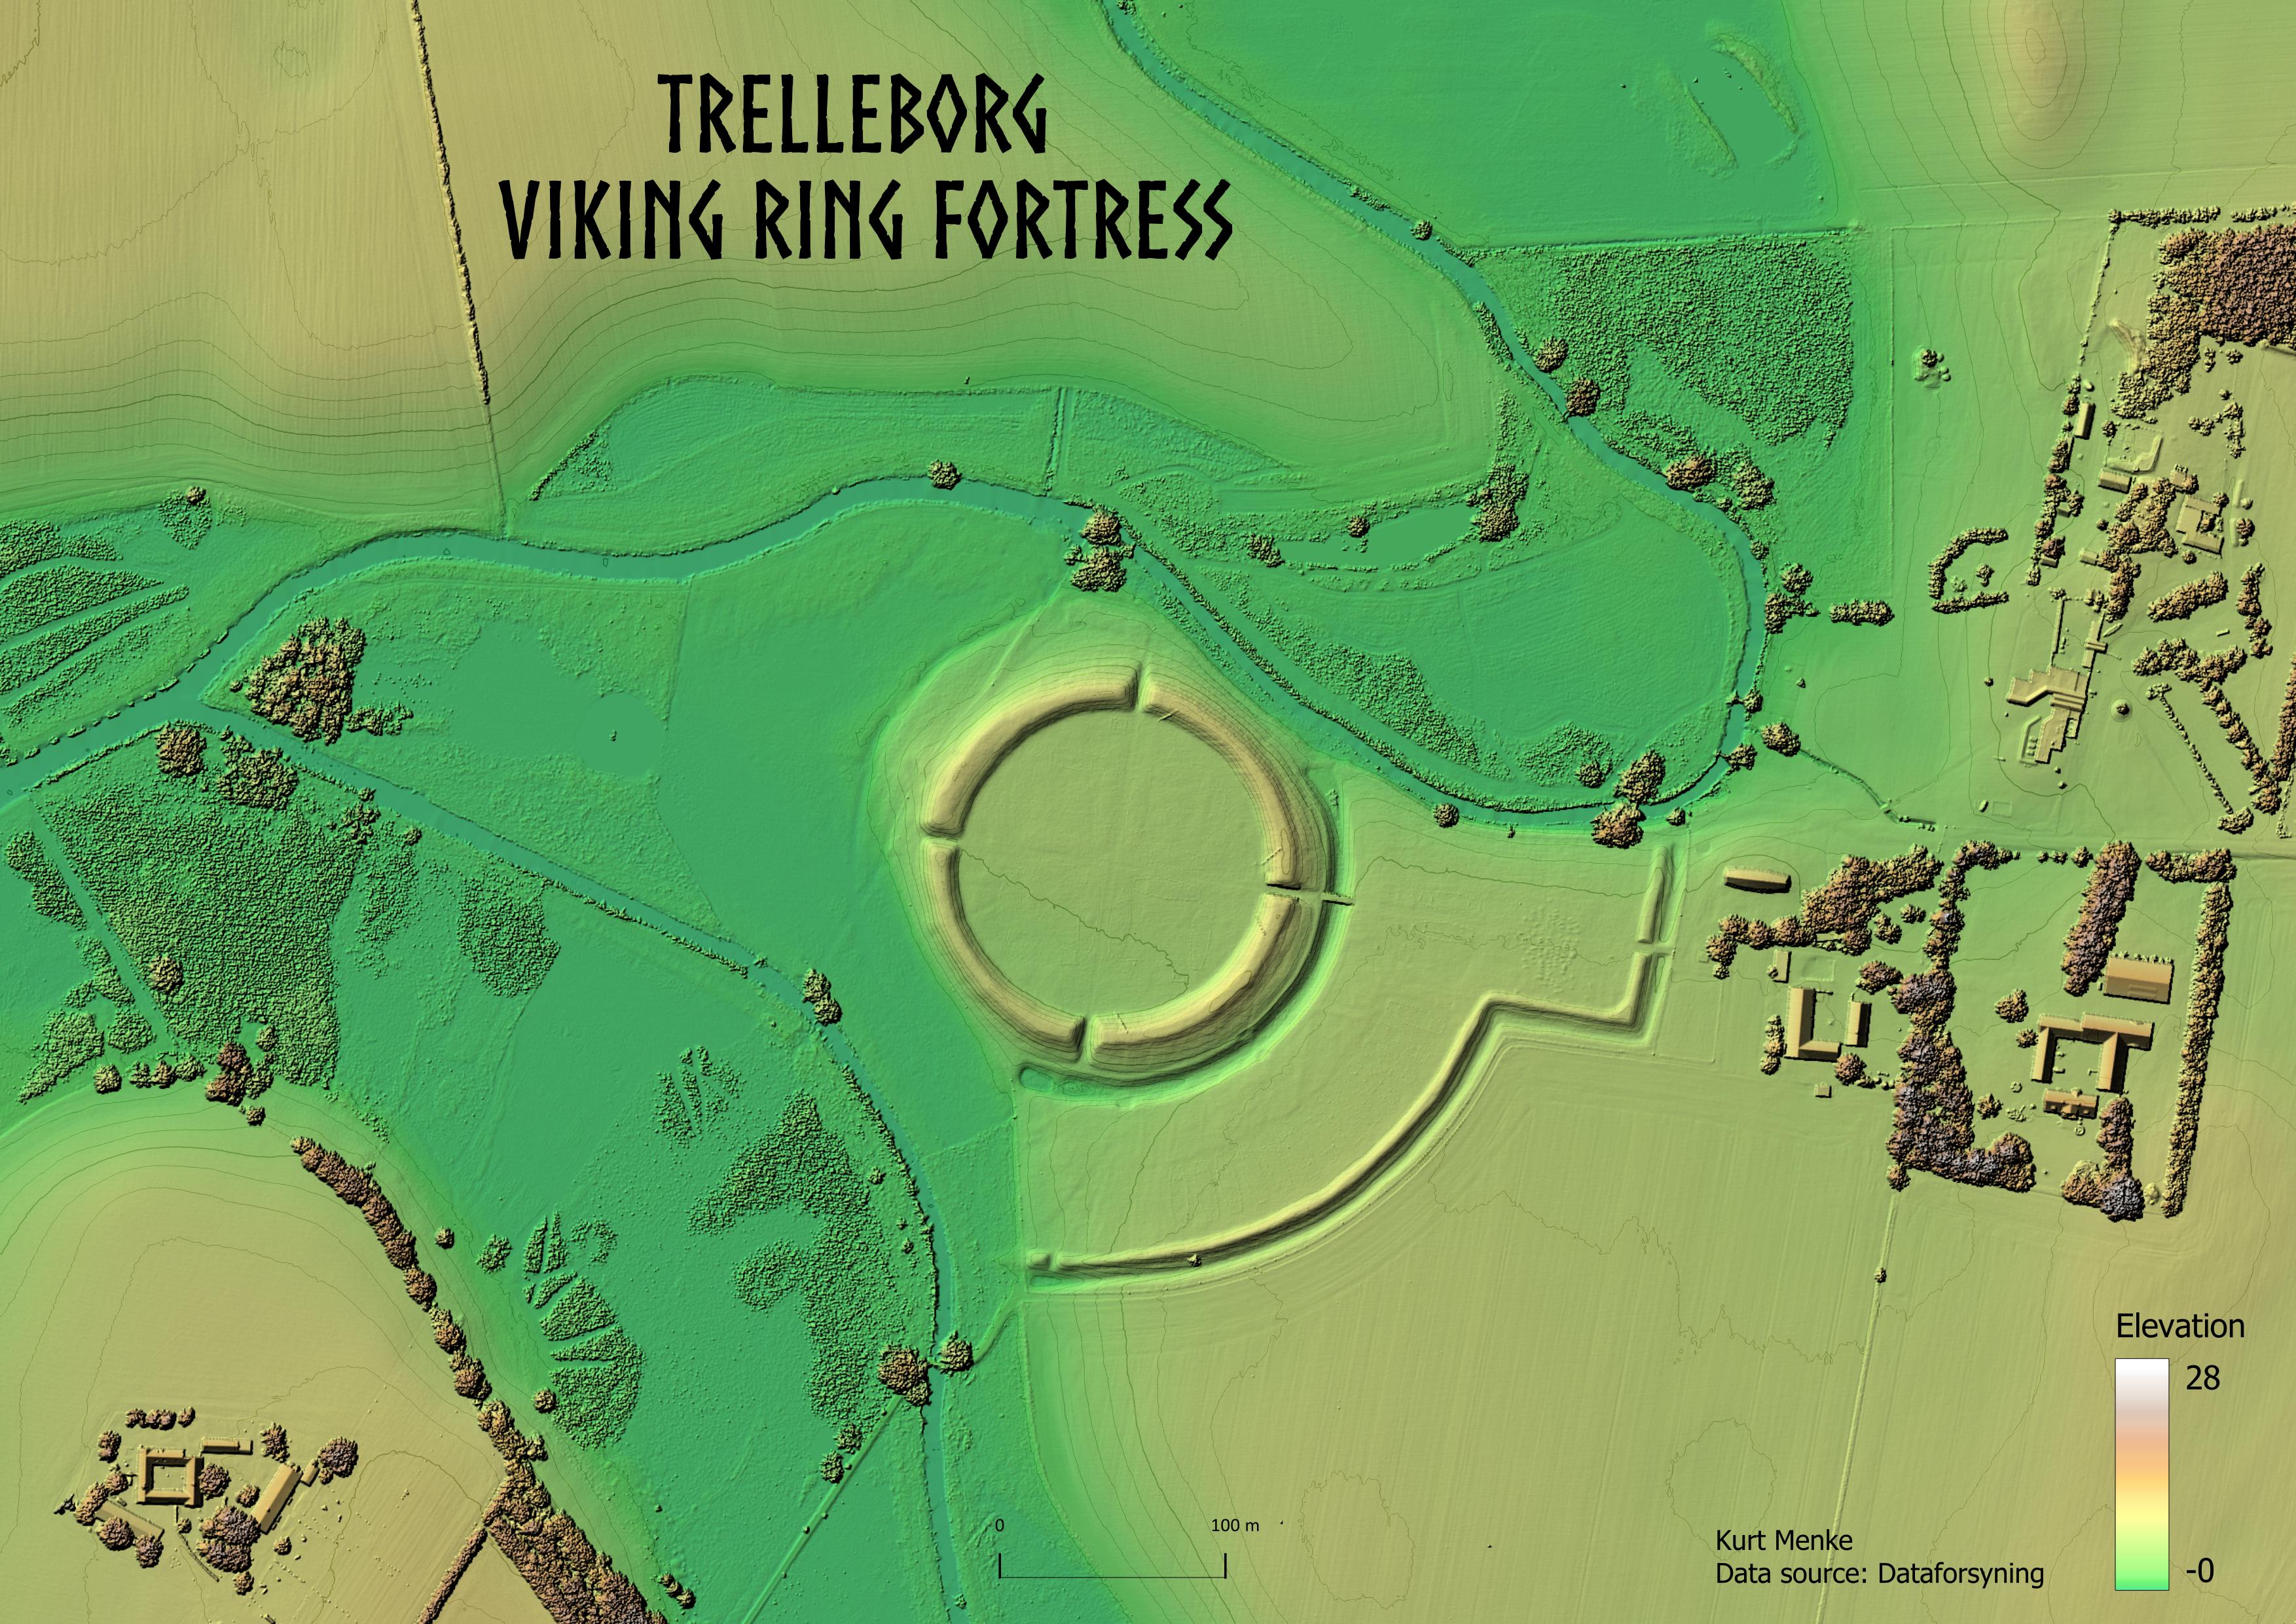
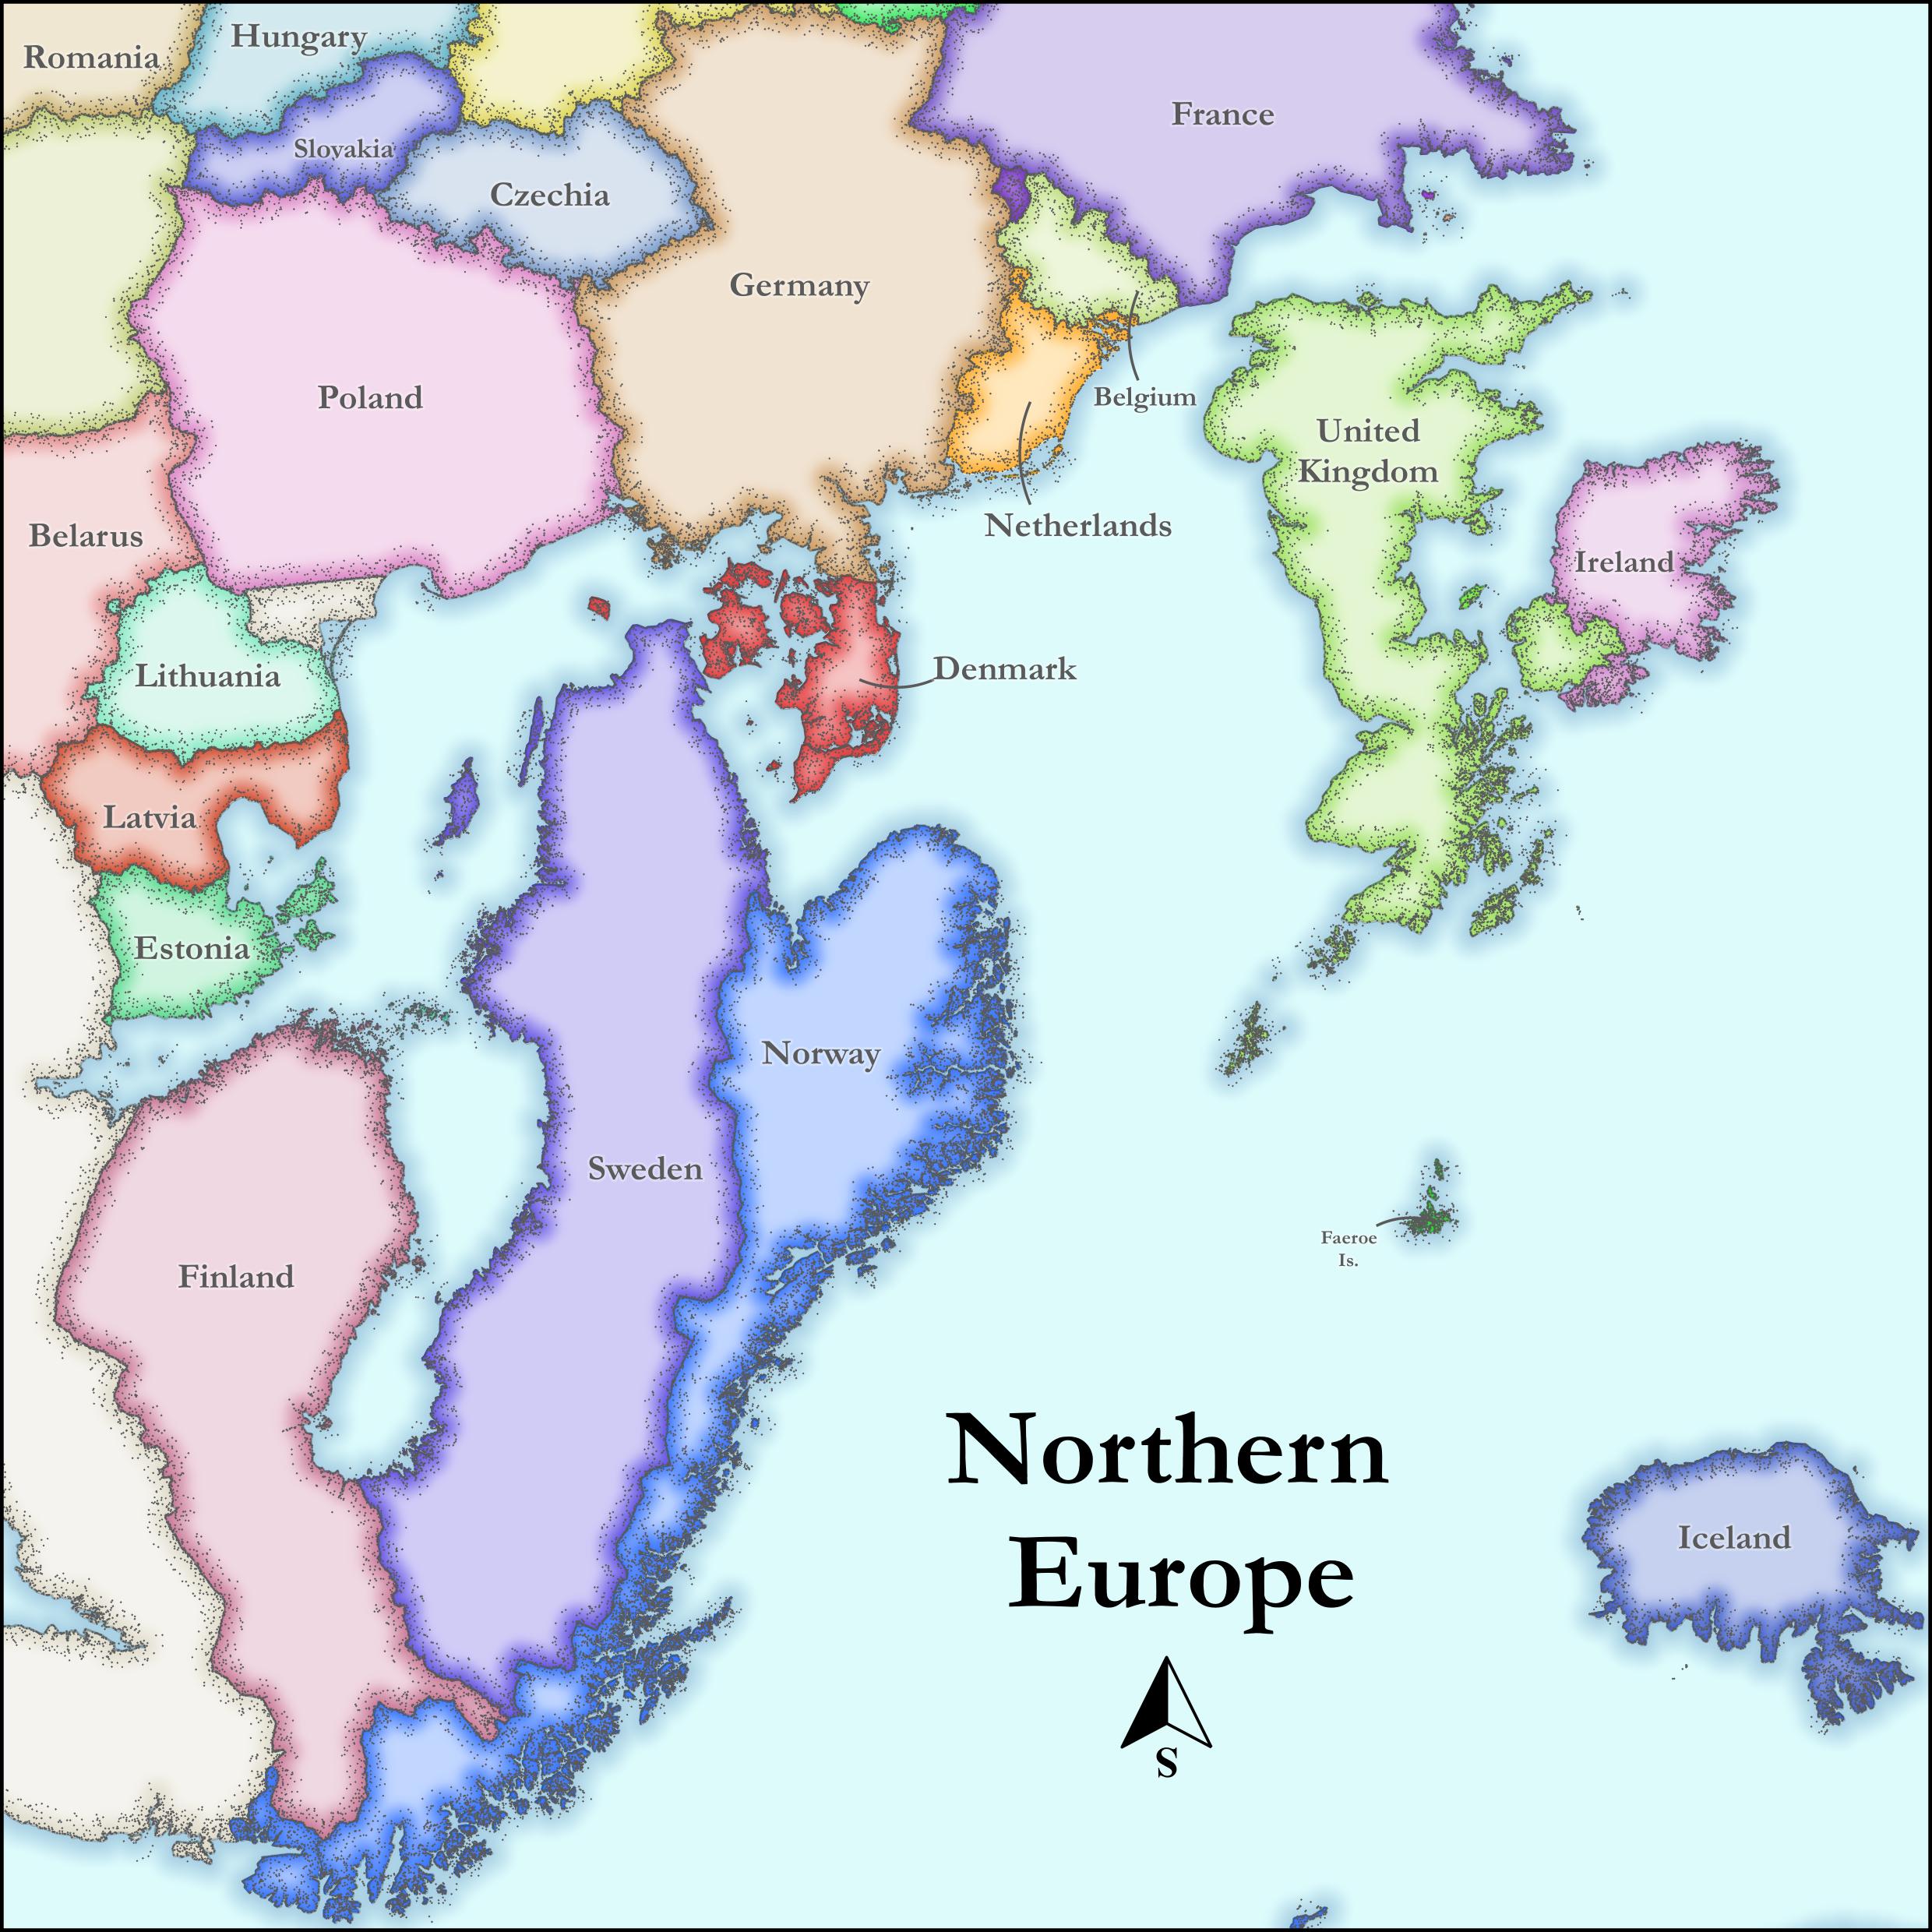
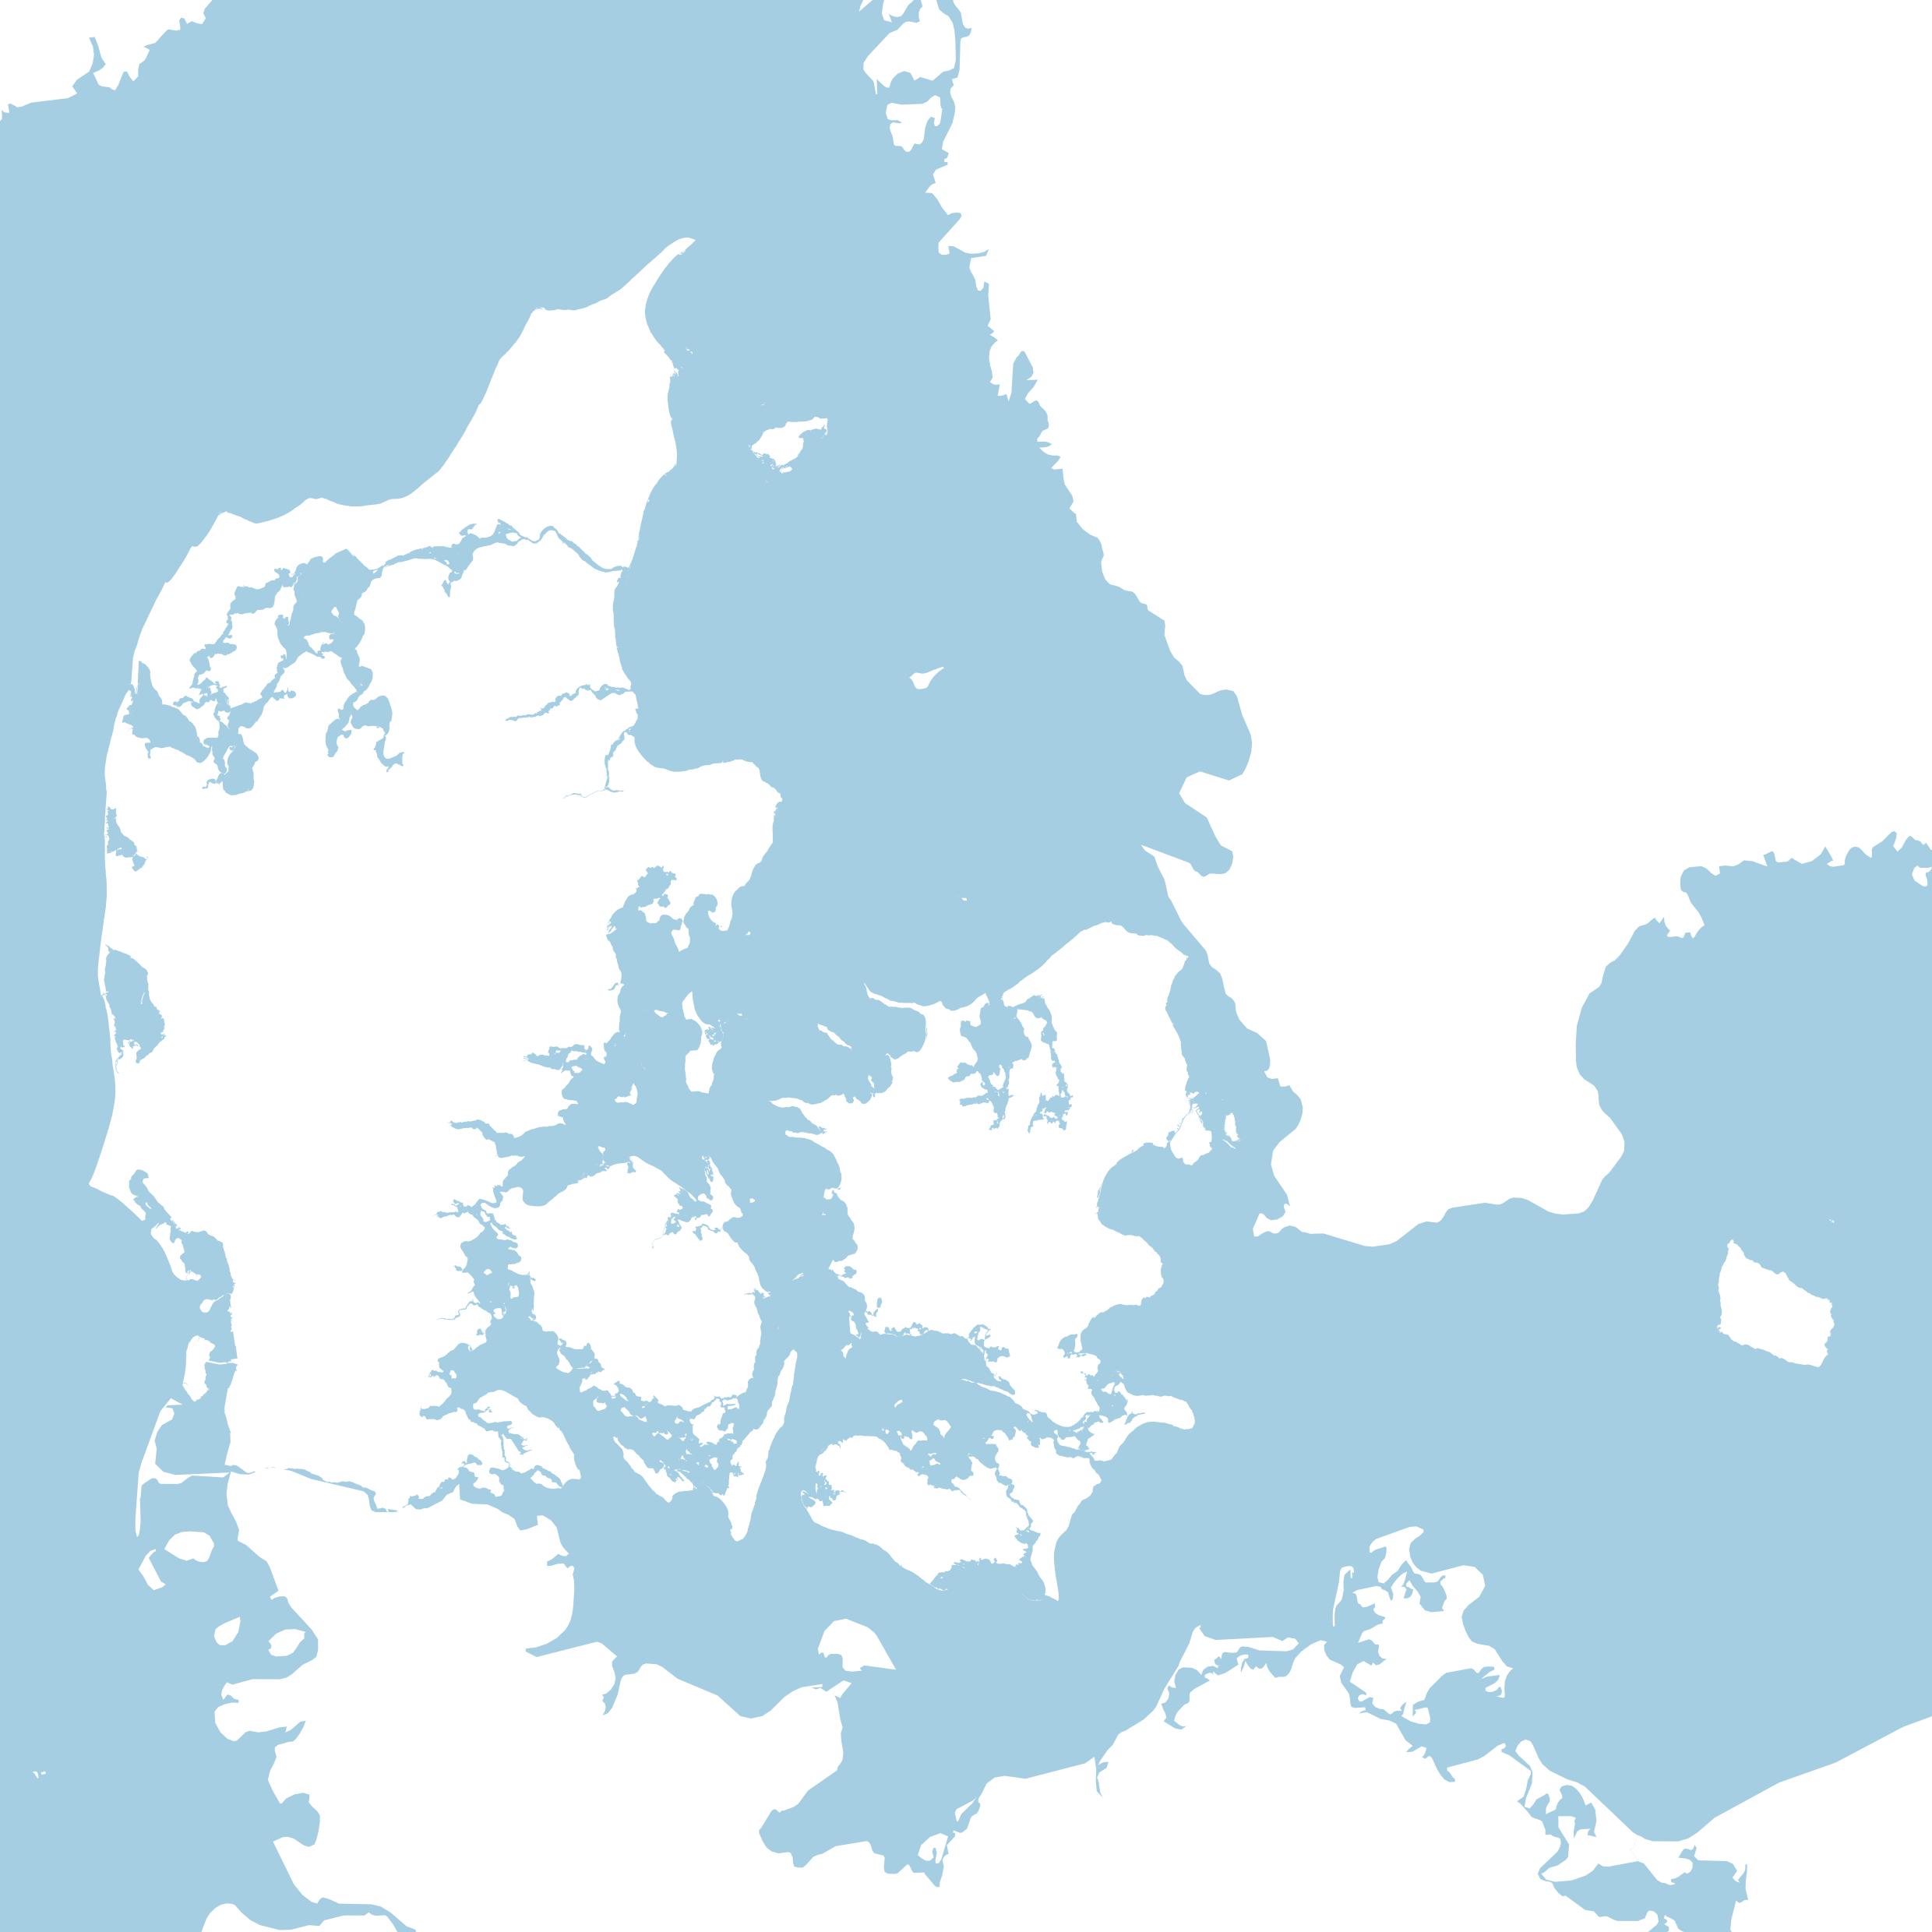
I had not planned on finishing this years challenge, but I kept finding inspiration and finished all but one day (South America). I made up for that missed day, by creating two Raster maps for Day 21. I focused on Denmark when possible. It was not always easy to find the time, but it was a lot of fun, and I learned more mapping tools and discovered new datasets! I also found a lot of inspiration from all the beautiful maps, which were created by cartographers from around the world, using many different tools.
I present my results here. On average I spent about an hour on each after work, so none are perfect. For each day I begin with the theme, followed by a short description and finally the map! I produced 90% of them using QGIS and all with open source software. Many of the maps use techniques I teach in the Data Visualization with QGIS online course. This course is held each spring and fall. You can read more and register for the next class here.
Want to learn more about data visualization and cartography with QGIS?
If you are interested in learning more about data visualization and cartography in QGIS, then sign up first for the Introduction to QGIS Symbology course, which starts on 30.January 2024 and/or the Data Visualization with QGIS course, which starts on 7.February, 2024.
We also have a large number of other QGIS courses, you can read more about them here.